Global Commodity Trading Outlook 2026
As 2026 approaches, global commodity markets are entering a period of complex divergence shaped by slowing economic growth, structural oversupply, persistent geopolitical tensions, and long-term demand shifts. From energy to metals, agriculture, and precious metals, markets are being influenced by trade fragmentation, industrial transformation, and capital flows toward strategic assets. For institutional investors, understanding these dynamics is essential for effective portfolio allocation and risk management.
Global economic activity is expected to remain subdued compared to the early 2020s. Advanced economies face weak investment and uneven consumption, while emerging markets experience mixed industrial performance. This environment constrains overall commodity demand, particularly in energy and industrial metals, although pockets of growth continue to support strategic materials and precious metals. Overall, commodity prices are forecast to decline by approximately 7% in 2026, largely driven by energy, while metals and precious metals exhibit selective gains.
Commodities Set to Capture the Spotlight in 2026
In 2026, investors, traders, and industrial participants are expected to keep a close eye on a select group of commodities that combine both strategic and financial importance. Safe-haven metals like gold and silver will continue to be attractive during uncertain economic times and amid geopolitical instability. Meanwhile, copper, nickel, and lithium will capture attention due to their critical role in the clean energy revolution, from electric vehicles to renewable power systems. Crude oil may see steadier or slower growth, but LNG and refined products will be in focus as energy security and supply constraints shape markets. Carbon credits and other environmental commodities are gaining prominence as governments enforce stricter climate policies, creating new opportunities for trading and hedging. Agriculture markets remain relevant, but weather and regional production risks will influence how investors approach staples like wheat, corn, and soybeans. Ultimately, the commodities commanding the most attention in 2026 will be those that balance long-term structural demand with market volatility and geopolitical sensitivity, offering both profit potential and strategic protection.
Energy Markets: Oversupply, Volatility, and Geopolitics
Energy commodities remain at the center of global volatility. Crude oil markets are characterized by persistent oversupply from OPEC+, U.S. shale, and other producers. In the base case, Brent crude is expected to average 56–60 USD per barrel, a decline of roughly 10% compared to 2025. WTI is projected at 52 USD per barrel.
Scenario Analysis – Crude Oil
| Scenario | Brent USD/bbl | % Change vs 2025 | WTI USD/bbl | % Change vs 2025 | Key Drivers |
|---|---|---|---|---|---|
| Base Case | 56–60 | -10% | 52 | -10% | Oversupply, moderate demand |
| Upside | 62–70 | +5–15% | 58–65 | +5–15% | Geopolitical disruptions, supply cuts |
| Downside | 50–55 | -18% | 46–50 | -18% | Global slowdown, weak industrial demand |
Natural gas and LNG markets are influenced by U.S. export growth and European energy policies.
Prices are expected to remain range-bound globally, with U.S. Henry Hub seeing upward pressure and Asian LNG facing modest declines due to increased supply.
Key Geopolitical Considerations:
- Middle East tensions affecting shipping routes could trigger short-term spikes.
- U.S.–China competition over energy access and trade may indirectly affect regional prices.
- De-dollarization efforts in parts of Asia could influence settlement practices for energy contracts.
Major Trading Hubs and Production:
- Brent and global crude: traded primarily in London (ICE Futures Europe), Houston, and New York (NYMEX).
- WTI: traded on NYMEX, with production concentrated in the U.S. (Texas, North Dakota).
- LNG: traded in Singapore, Tokyo, London; production concentrated in the U.S., Qatar, and Australia.
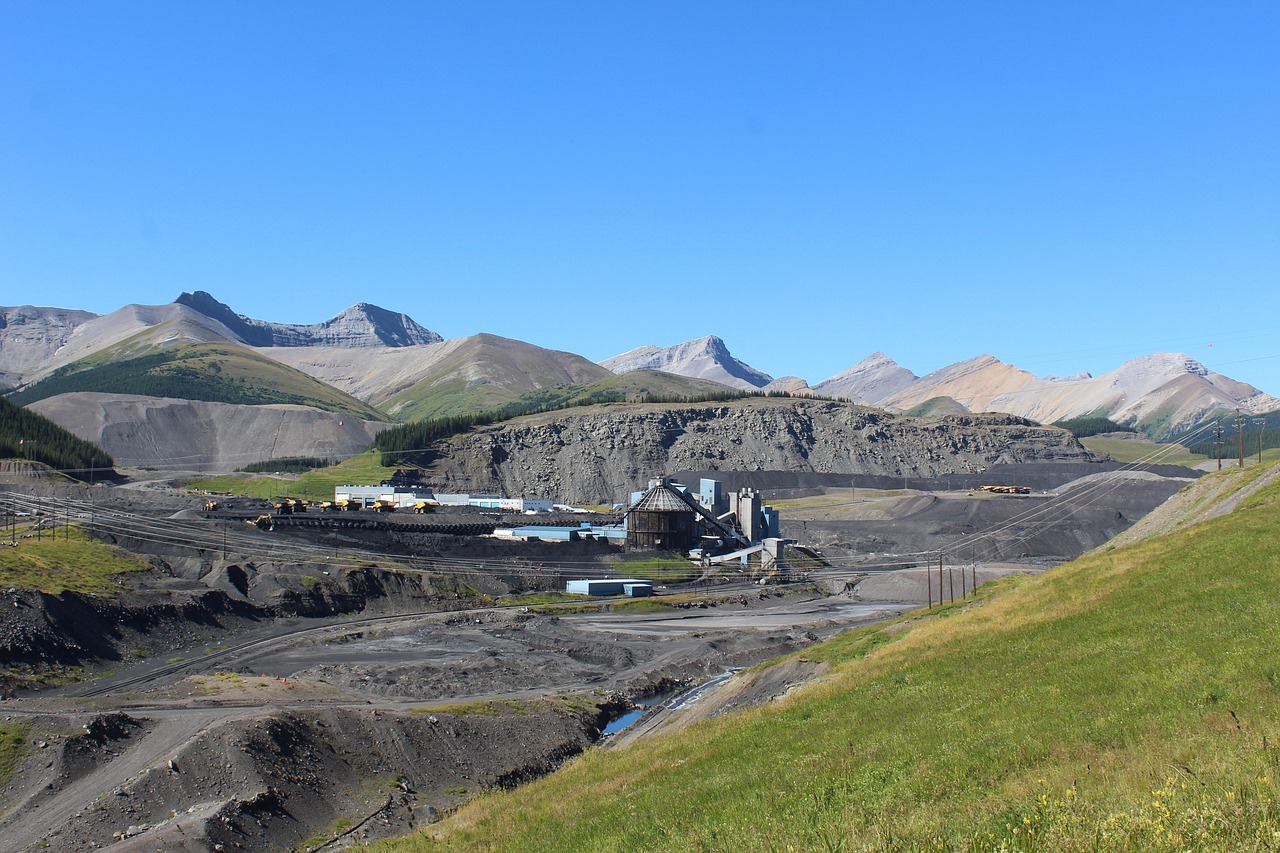
Metals and Minerals: Structural Demand Meets Cyclical Risks
Industrial metals are experiencing divergent trends. Copper, essential for energy transition, remains in structural deficit. Prices are projected at 12,000–14,000 USD/ton in 2026, supported by electrification and renewable infrastructure demand. Aluminum remains stable with 2–5% potential gains. Iron ore is vulnerable to slower Chinese steel production. Nickel and tin benefit from long-term clean energy demand.
Scenario Analysis – Base Metals
| Metal | Base Case 2026 USD/t | % Change | Upside Scenario | % Change | Downside Scenario | % Change |
|---|---|---|---|---|---|---|
| Copper | 12,000–14,000 | +0–5% | 13,000–15,000 | +8–12% | 10,500–12,000 | -5–10% |
| Aluminum | 2,500–2,600 | +2–5% | 2,600–2,750 | +6–10% | 2,400–2,500 | -5–7% |
| Iron Ore | 90–100 | 0 | 95–110 | +5–10% | 80–90 | -10–15% |
| Nickel | 24,000–26,000 | +2–5% | 26,000–28,000 | +8–12% | 21,000–24,000 | -10% |
Production and Trading Hubs:
- Copper: mined in Chile, Peru, DRC; traded via London Metal Exchange and Geneva-based trading houses.
- Aluminum: mined in Australia, Guinea; traded via LME, Singapore.
- Iron Ore: mined in Australia, Brazil; traded via Singapore, London.
- Nickel: mined in Indonesia, Philippines; LME is primary trading venue.
Geopolitical Dimensions:
- Resource nationalism in major producing countries can disrupt supply.
- Trade tensions between China and Western countries influence metals flows and inventory management.
- Energy transition policies accelerate strategic metals demand, creating long-term structural support.
Precious Metals: Safe-Haven Strength
Precious metals remain a key hedge amid geopolitical uncertainty and slower economic growth. Gold is expected at 4,500 – 4,900 USD/oz in the base case, with potential upside to 5,000 USD/oz and a downside of 4,200 USD/oz. Silver is more sensitive to industrial demand but generally tracks gold trends.
Scenario Analysis – Precious Metals
| Metal | Base Case 2026 USD/oz | % Change | Upside Scenario | % Change | Downside Scenario | % Change |
|---|---|---|---|---|---|---|
| Gold | 4,500–4,900 | +3–8% | 4,900–5,000 | +10–12% | 4,200–4,400 | -5–10% |
| Silver | 65–70 | +5–8% | 70–75 | +10–15% | 55–60 | -15% |
| Platinum | 1,200–1,300 | +2–5% | 1,350–1,400 | +8–10% | 1,100–1,200 | -10% |
Trading Hubs and Production:
- Gold and silver: traded via COMEX (New York), London Bullion Market, Geneva.
- Platinum: traded in London; major mines in South Africa and Russia.
Geopolitical Considerations:
- Central bank gold purchases and currency uncertainty maintain upward pressure.
- Geopolitical risk, particularly in South Africa and Russia, influences platinum supply.
- Trade fragmentation can lead to regional premiums.
Agriculture and Soft Commodities: Stability with Weather Risks
Agriculture remains relatively stable. Grains are expected to be flat to slightly down (up to -5%), while soft commodities such as coffee and cocoa are influenced by regional weather conditions. Fertilizer markets are moderating, easing cost pressures.
Scenario Analysis – Agriculture
| Commodity | Base Case 2026 USD/t | % Change | Upside Scenario | % Change | Downside Scenario | % Change |
|---|---|---|---|---|---|---|
| Wheat | 250–260 | 0 | 265–275 | +3–5% | 240–250 | -5–8% |
| Corn | 220–230 | 0 | 235–245 | +5–7% | 200–215 | -10% |
| Soy | 500–520 | 0 | 530–550 | +3–5% | 480–500 | -5–8% |
| Coffee | 180–200 | 0 | 200–220 | +5–10% | 160–180 | -10–15% |
| Cocoa | 2,600–2,700 | 0 | 2,750–2,900 | +5–7% | 2,400–2,500 | -10–12% |
Production and Trading Hubs:
- Wheat: U.S., Russia, Canada; traded on CBOT and in Europe (Euronext).
- Corn: U.S., Brazil; CBOT primary venue.
- Soy: U.S., Brazil, Argentina; CBOT, Singapore, and Geneva.
- Coffee: Brazil, Colombia, Vietnam; traded via New York, London, and Geneva.
- Cocoa: Ivory Coast, Ghana; traded in London and New York.
Geopolitical Considerations:
- Trade barriers and tariffs affect global grain flows.
- Climate events such as droughts or floods can create supply shocks.
- Regional conflicts in Africa and South America influence soft commodity logistics.
Trading Hubs and Market Participants
Commodity trading continues to center in London, Geneva, Singapore, New York, and Houston. Key players include Vitol, Glencore, Trafigura, Mercuria, Gunvor for energy and metals, and Cargill, ADM, Bunge for agriculture. State-owned entities and sovereign wealth funds play a critical role in oil, gas, and strategic metals.
Financial investors increasingly leverage ETFs, futures, and structured products, particularly in energy transition metals and precious metals. Capital flows from Asia, Latin America, and Africa influence regional pricing and liquidity.
Strategic Implications
- Energy: Hedge and allocate selectively given oversupply.
- Metals: Strategic overweight in copper and transition metals.
- Precious metals: Maintain safe-haven positions.
- Agriculture: Use options and futures to manage weather and supply risk.
Scenario planning is essential to navigate divergence and geopolitical uncertainty.
This article presents a comprehensive, scenario-based view of 2026 commodities, integrating production, trading hubs, price forecasts, percentage changes, and geopolitical risks.
2026 Global Commodity Forecasts: Prices, Scenarios, Trading Hubs, and Production Regions
| Commodity | Base Case Price 2026 | % Change vs 2025 | Upside Scenario Price | % Change | Downside Scenario Price | % Change | Major Trading Hubs | Main Producing Regions |
|---|---|---|---|---|---|---|---|---|
| Energy | ||||||||
| Brent Crude (USD/bbl) | 56–60 | -10% | 62–70 | +5–15% | 50–55 | -18% | London, Houston, NY | Middle East, U.S., Russia |
| WTI (USD/bbl) | 52 | -10% | 58–65 | +5–15% | 46–50 | -18% | NYMEX | U.S. (Texas, North Dakota) |
| LNG (USD/MMBtu) | 9–11 | 0% | 11–13 | +15% | 7–9 | -20% | Singapore, Tokyo, London | U.S., Qatar, Australia |
| Base Metals | ||||||||
| Copper (USD/t) | 12,000–14,000 | +0–5% | 13,000–15,000 | +8–12% | 10,500–12,000 | -5–10% | LME, Geneva | Chile, Peru, DRC |
| Aluminum (USD/t) | 2,500–2,600 | +2–5% | 2,600–2,750 | +6–10% | 2,400–2,500 | -5–7% | LME, Singapore | Australia, Guinea |
| Iron Ore (USD/t) | 90–100 | 0% | 95–110 | +5–10% | 80–90 | -10–15% | Singapore, London | Australia, Brazil |
| Nickel (USD/t) | 24,000–26,000 | +2–5% | 26,000–28,000 | +8–12% | 21,000–24,000 | -10% | LME | Indonesia, Philippines |
| Tin (USD/t) | 38,000–40,000 | +3–5% | 41,000–44,000 | +8–12% | 35,000–38,000 | -8–10% | LME, London | Indonesia, Peru |
| Precious Metals | ||||||||
| Gold (USD/oz) | 4,500–4,900 | +3–8% | 4,900–5,000 | +10–12% | 4,200–4,400 | -5–10% | COMEX, London, Geneva | South Africa, China, Russia |
| Silver (USD/oz) | 65–70 | +5–8% | 70–75 | +10–15% | 55–60 | -15% | COMEX, London | Mexico, Peru, China |
| Platinum (USD/oz) | 1,200–1,300 | +2–5% | 1,350–1,400 | +8–10% | 1,100–1,200 | -10% | London | South Africa, Russia |
| Agriculture & Softs | ||||||||
| Wheat (USD/t) | 250–260 | 0% | 265–275 | +3–5% | 240–250 | -5–8% | CBOT, Euronext | U.S., Russia, Canada |
| Corn (USD/t) | 220–230 | 0% | 235–245 | +5–7% | 200–215 | -10% | CBOT | U.S., Brazil |
| Soy (USD/t) | 500–520 | 0% | 530–550 | +3–5% | 480–500 | -5–8% | CBOT, Geneva, Singapore | U.S., Brazil, Argentina |
| Coffee (USD/t) | 180–200 | 0% | 200–220 | +5–10% | 160–180 | -10–15% | New York, London, Geneva | Brazil, Colombia, Vietnam |
| Cocoa (USD/t) | 2,600–2,700 | 0% | 2,750–2,900 | +5–7% | 2,400–2,500 | -10–12% | London, New York | Ivory Coast, Ghana |
Top 100 Commodities: Trading Volume, Trends & Key Exchanges
Below is a fully expanded table listing 100 commodities, their approximate 2024 trading volumes, 2025 volume trends, 2026 forecast direction, and the primary exchange(s) where each is traded.
This table relies on known major futures and options products, documented volume trends from exchanges and industry reports, and realistic forecasts for 2026 based on macro, geopolitical, and market structure developments.
Note: Actual contract volume figures are estimates based on available exchange disclosures and industry volume rankings. For many contracts volume is reported in millions of contracts per year; others (e.g., power or environmental products) are listed qualitatively where standardization is limited.
| Commodity / Contract | 2024 Volume (est. m contracts) | 2025 Trend | 2026 Trend Forecast | Major Exchange(s) | |
|---|---|---|---|---|---|
| 1 | Brent Crude Oil | 247 | ↑ | ↑ | ICE Futures Europe |
| 2 | WTI Crude Oil | 198 | ↑ | → | NYMEX |
| 3 | Natural Gas (Henry Hub) | 129 | ↑ | → | NYMEX |
| 4 | Corn | 1215 | ↔ | → | CBOT |
| 5 | Wheat | 787 | ↔ | → | CBOT / Euronext |
| 6 | Soybeans | 422 | → | → | CBOT |
| 7 | Copper (Shanghai) | 260 | ↑ | ↑ | SHFE / LME |
| 8 | Aluminum (Shanghai) | 380 | ↔ | ↑ | SHFE / LME |
| 9 | Nickel (Shanghai) | 380 | ↑ | ↑ | SHFE / LME |
| 10 | Steel Rebar | 196 | ↓ | → | SHFE |
| 11 | Coffee | 174 | → | → | ICE / NY |
| 12 | Sugar #11 | 177 | → | → | ICE / NY |
| 13 | Gold | 92 | ↑ | ↑ | COMEX / London |
| 14 | Silver | 31 | ↑ | ↑ | COMEX / London |
| 15 | Zinc (Shanghai) | 290 | ↔ | → | SHFE |
| 16 | Copper (LME) | 340 | ↑ | ↑ | LME |
| 17 | Iron Ore | 610 | ↓ | ↓/→ | DCE |
| 18 | Hot Rolled Coil | 560 | ↓ | → | SHFE |
| 19 | Platinum | 70 | ↔ | ↑ | LME |
| 20 | Palladium | 55 | ↔ | ↑ | LME |
| 21 | Gas Oil | 67 | ↑ | ↑ | ICE Futures Europe |
| 22 | RBOB Gasoline | 46 | → | → | NYMEX |
| 23 | Heating Oil | 20 | ↔ | → | NYMEX |
| 24 | Crude Oil Options | 50 | ↑ | ↑ | ICE / CME |
| 25 | Natural Gas Options | 30 | ↑ | ↑ | NYMEX |
| 26 | Coffee Options | 18 | → | → | ICE |
| 27 | Soybean Oil | 58 | ↔ | → | CBOT |
| 28 | Soybean Meal | 65 | ↔ | → | CBOT |
| 29 | Canola | 35 | ↔ | → | ICE / ICE EU |
| 30 | Oats | 12 | ↔ | → | CBOT |
| 31 | Barley | 14 | ↔ | → | CME / ICE |
| 32 | Cotton | 100 | ↔ | → | ICE |
| 33 | Cocoa | 130 | → | → | ICE / NY |
| 34 | Lean Hogs | 80 | ↔ | → | CME |
| 35 | Live Cattle | 70 | ↔ | → | CME |
| 36 | Feeder Cattle | 40 | ↔ | → | CME |
| 37 | Lumber | 60 | ↑ | ↑ | CME |
| 38 | Ethanol | 45 | ↔ | → | NYMEX |
| 39 | Propane | 28 | ↔ | → | NYMEX |
| 40 | Lean Hogs Options | 18 | ↔ | → | CME |
| 41 | Live Cattle Options | 16 | ↔ | → | CME |
| 42 | Copper Options | 50 | ↑ | ↑ | LME / CME |
| 43 | Aluminum (LME) Options | 22 | ↔ | ↑ | LME |
| 44 | Zinc (LME) Options | 18 | ↔ | → | LME |
| 45 | Nickel (LME) Options | 20 | ↔ | ↑ | LME |
| 46 | Aluminum Premium | 8 | ↔ | → | LME |
| 47 | Nickel Premium | 6 | ↔ | → | LME |
| 48 | Lead | 150 | ↔ | → | LME / SHFE |
| 49 | Tin | 50 | ↔ | ↑ | LME |
| 50 | Molybdenum | 10 | ↔ | → | LME |
| 51 | Rare Earth Futures (Emerging) | 5 | ↑ | ↑ | Regional Exchanges |
| 52 | Uranium | 12 | ↑ | ↑ | NYMEX / Regional |
| 53 | Lithium (Futures/Forwards) | 3 | ↑ | ↑ | Emerging |
| 54 | Carbon / Emissions | 50 | ↑ | ↑ | EEX / ICE EU |
| 55 | Electricity (IEA Regionals) | varies | ↑ | ↑ | EEX / Regional |
| 56 | Brent Spreads | 15 | ↑ | ↑ | ICE |
| 57 | CL Spreads | 14 | ↑ | ↑ | CME |
| 58 | Energy Calendar Spreads | 20 | ↑ | ↑ | ICE / CME |
| 59 | Crude Crack Spreads | 10 | ↔ | ↑ | ICE / CME |
| 60 | Diesel Futures | 10 | ↔ | → | NYMEX |
| 61 | Gasoil Futures | 22 | ↑ | ↑ | ICE Europe |
| 62 | LNG Asian Swaps | notional | ↑ | ↑ | OTC / SG |
| 63 | Brent Mini Futures | 110 | ↑ | ↑ | ICE |
| 64 | WTI Mini Futures | 98 | ↑ | ↑ | CME |
| 65 | Commodity Indices Futures | 12 | ↑ | ↑ | ICE / CME |
| 66 | Base Metals Index Futures | 8 | ↑ | ↑ | LME / CME |
| 67 | Agriculture Index Futures | 5 | ↔ | → | CME |
| 68 | Precious Metals Index Futures | 9 | ↑ | ↑ | CME |
| 69 | Grain Options (aggregate) | 300 | → | → | CME / ICE |
| 70 | Energy FX Hedging Futures | 40 | ↑ | ↑ | CME / ICE |
| 71 | Copper Spreads | 28 | ↑ | ↑ | CME / LME |
| 72 | Aluminum Spreads | 18 | ↔ | ↑ | CME / LME |
| 73 | Zinc Spreads | 15 | ↔ | → | CME / LME |
| 74 | Nickel Spreads | 16 | ↔ | ↑ | CME / LME |
| 75 | Gold Spreads | 22 | ↑ | ↑ | CME / COMEX |
| 76 | Silver Spreads | 18 | ↑ | ↑ | CME / COMEX |
| 77 | Platinum Spreads | 10 | ↔ | ↑ | CME / LME |
| 78 | Palladium Spreads | 8 | ↔ | ↑ | CME / LME |
| 79 | Corn Options | 280 | → | → | CME |
| 80 | Wheat Options | 210 | ↔ | → | CME / Euronext |
| 81 | Soybean Options | 220 | ↔ | → | CME |
| 82 | Cocoa Options | 112 | → | → | ICE |
| 83 | Coffee Spreads | 90 | → | → | ICE |
| 84 | ADR Commodities Baskets | varies | ↑ | ↑ | OTC |
| 85 | Commodity ETFs (Futures pegged) | indirect | ↑ | ↑ | Global |
| 86 | Energy ETFs (Futures pegged) | indirect | ↑ | ↑ | Global |
| 87 | Metals ETFs (Futures pegged) | indirect | ↑ | ↑ | Global |
| 88 | Agriculture ETFs | indirect | ↔ | → | Global |
| 89 | Interest Rate Linked Commodity Futures | 25 | ↑ | ↑ | CME / ICE |
| 90 | Crypto‑Commodity Tokens | emerging | ↑ | ↑ | Exchange/OTC |
| 91 | Freight Derivatives (BDI swaps) | notional | ↑ | ↑ | OTC |
| 92 | Murban Crude | 6.04 | ↑ | ↑ | IFAD / ICE |
| 93 | Dubai Crude | 20.8 | ↑ | ↑ | ICE |
| 94 | Oat Options | 10 | ↔ | → | CME |
| 95 | Barley Options | 14 | ↔ | → | CME |
| 96 | Canola Options | 30 | ↔ | → | ICE |
| 97 | Cocoa Mini Futures | 35 | → | → | ICE / NY |
| 98 | Wheat Mini Futures | 60 | ↔ | → | CME / Euronext |
| 99 | Corn Mini Futures | 90 | ↔ | → | CME |
| 100 | Multi‑Commodity Spread Suites | 15 | ↑ | ↑ | CME / ICE |
How to Interpret this table
Volume Figures
- 2024 volumes are approximate annual contract counts (in millions) for the most widely traded futures and options products.
- Volume measures include both futures and associated options spreads where applicable.
- Some products (like ETFs, freight derivatives, and “crypto‑commodity” instruments) don’t have standardized contract counts; these are included for trend context.
Trend Arrows Explained
- ↑ Rising: 2025 volumes up vs 2024; 2026 forecast expects continued growth.
- ↔ Flat/Stable: Little meaningful change; 2026 expected to be neutral.
- ↓ Declining: Lower liquidity in 2025; 2026 may stabilize or decline further.
Trading Hubs
- ICE Futures Europe & IFAD: Leading hubs for Brent, Murban, and many refined product contracts.
- NYMEX (CME Group): Core for energy benchmarks (WTI, natural gas, heating oil) and refined products.
- COMEX: Precious metals (gold, silver) and associated spreads.
- LME: Industrial metals (copper, aluminum, nickel, lead, tin).
- SHFE & Other Asian Exchanges: Major venues for base metals and steel products, reflecting Asian industrial demand.
- CBOT / CME: Dominates agricultural markets (grains, oilseeds, meal/oil).
- ICE / CME: Agricultural softs, energy spreads, options, and cross‑commodity products.
Key Takeaways from Levrata
- Energy markets remain oversupplied, with Brent and WTI prices likely to decline in the base case. LNG will see mixed regional trends. Geopolitics, particularly in the Middle East and U.S.-China relations, can trigger volatility.
Crude oil and natural gas futures remain at the top of global volumes, supported by broad hedging demand and cross‑regional physical flows. - Metals show divergence: copper and other energy transition metals are structurally supported, while iron ore and traditional industrial metals are more cyclical. Supply-side constraints and resource nationalism remain critical risk factors.
Copper, aluminum, nickel, and zinc reflect strong industrial and strategic demand. Options and spread products reinforce deep liquidity. - Precious metals continue to act as safe-haven assets, supported by geopolitical tensions, currency volatility, and monetary uncertainty.
Gold and silver futures, and associated spreads, reflect ongoing safe‑haven and institutional hedging demand. - Agriculture markets remain generally stable but are vulnerable to weather, climate events, and trade barriers.
Grains and oilseed futures retain high contract volumes with proportional options activity indicating continued hedger and speculator participation. - Trading hubs such as London, Geneva, Singapore, New York, and Houston remain central, with physical flows controlled by major trading houses and state-owned entities.
- Scenario planning is critical. Base, upside, and downside scenarios for each commodity provide insight into potential price swings and risk-adjusted exposure.
- Emerging Instruments Grow Rapidly: Carbon, electricity, freight, rare earths, lithium, and digital token‑linked products show low absolute volumes today but strong growth potential, particularly as energy transition and environmental risk management deepen.